config_roundtrip
Violin Plot
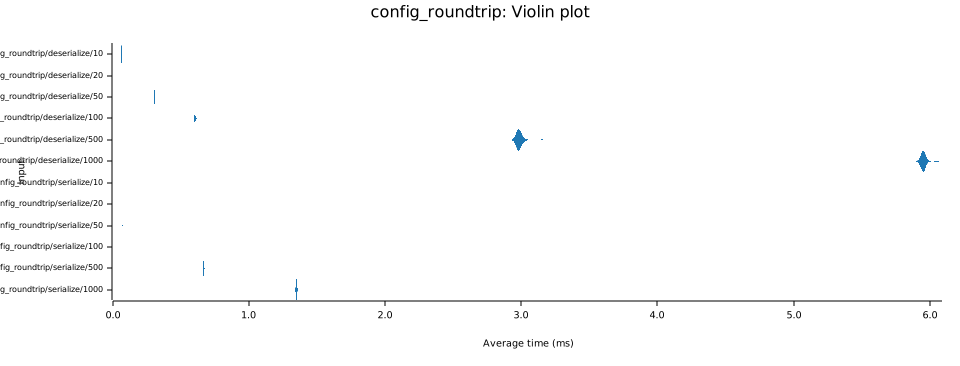
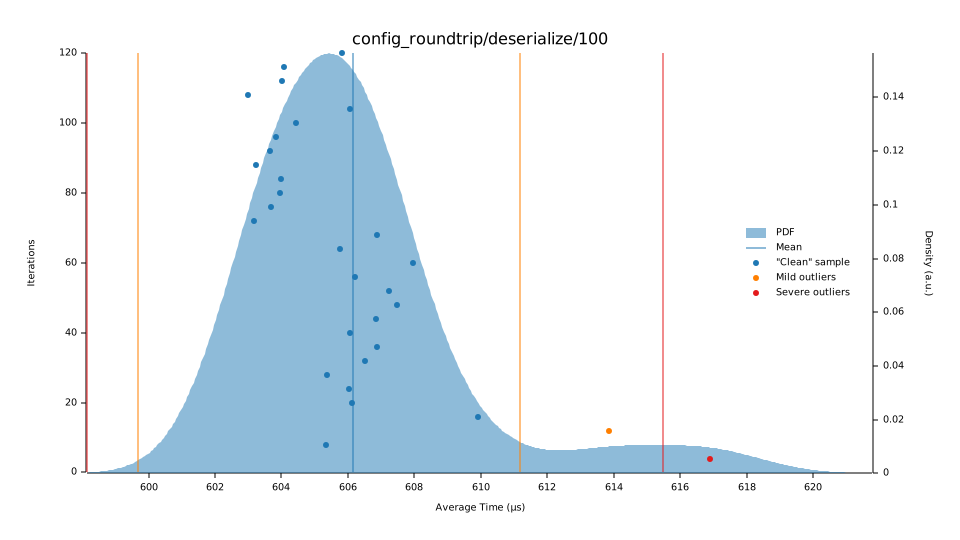
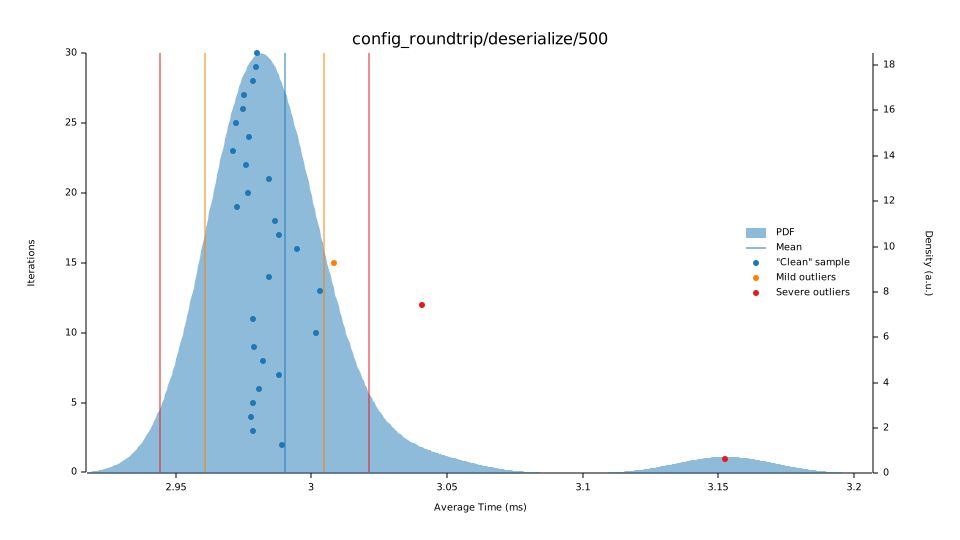
This chart shows the relationship between function/parameter and iteration time. The thickness of the shaded region indicates the probability that a measurement of the given function/parameter would take a particular length of time.
Line Chart
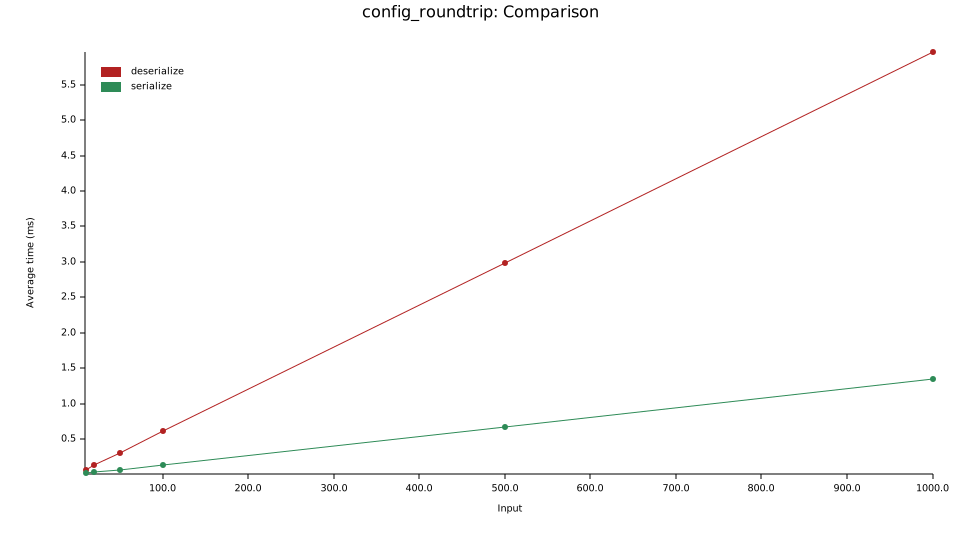
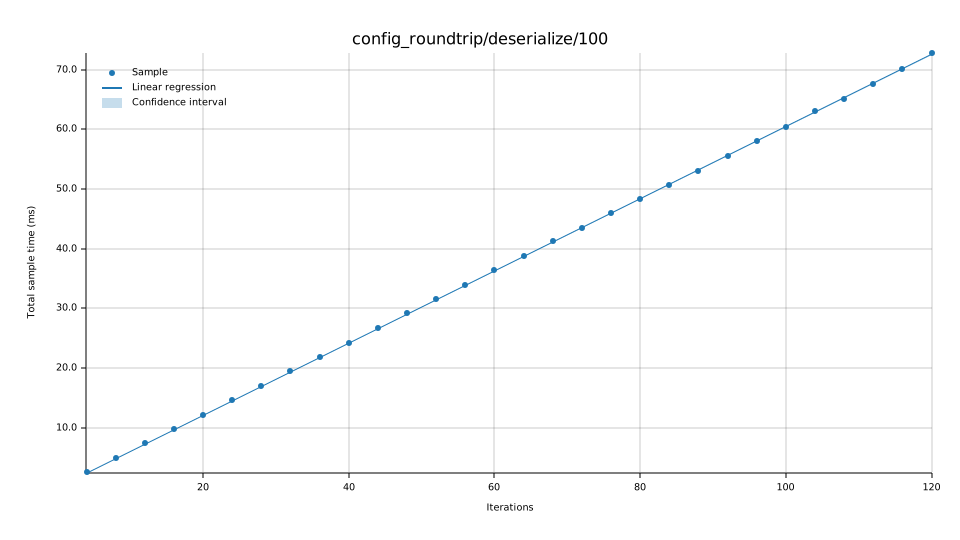
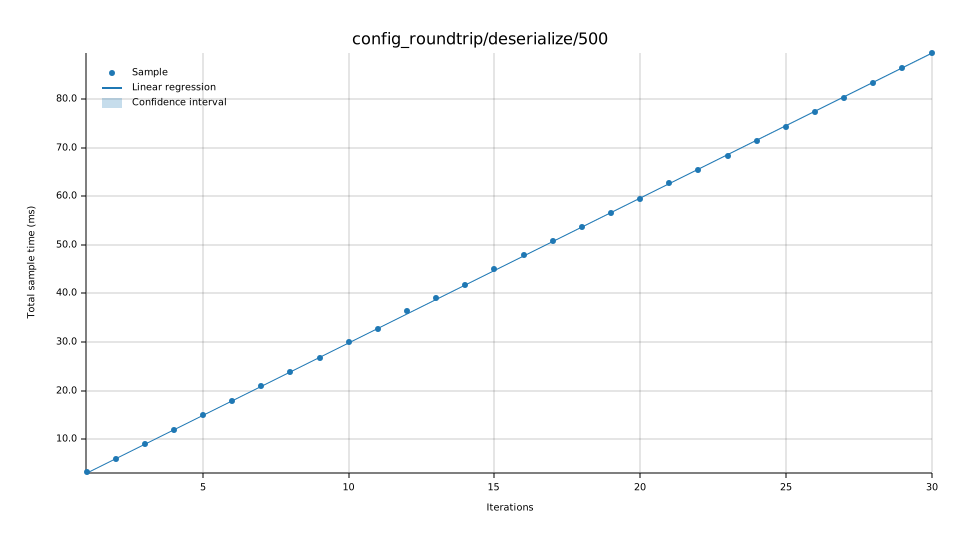
This chart shows the mean measured time for each function as the input (or the size of the input) increases.
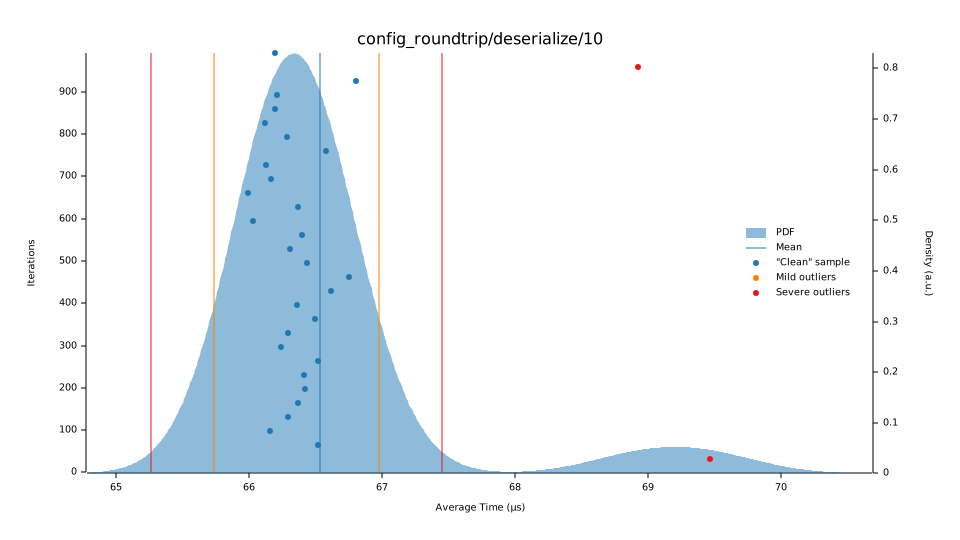
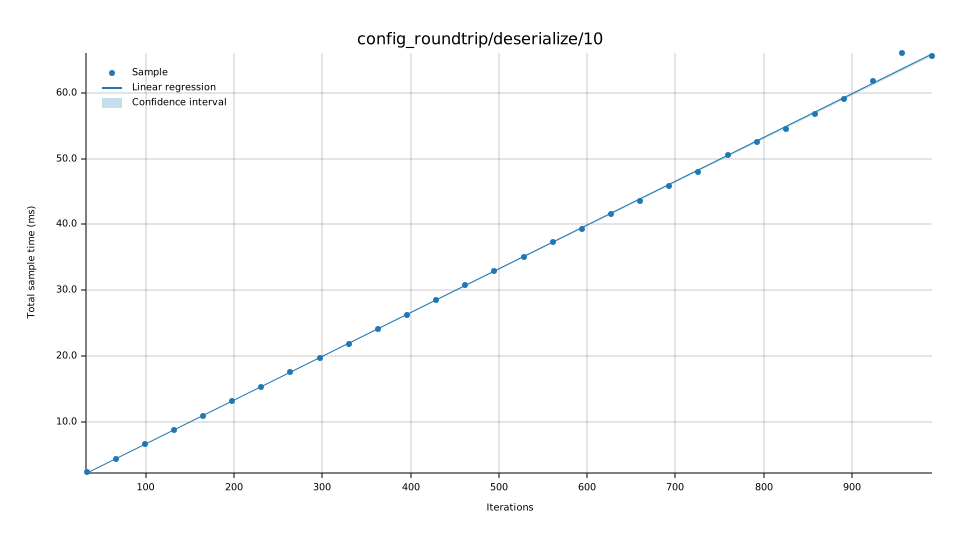
config_roundtrip/deserialize/10
|
|
config_roundtrip/deserialize/20
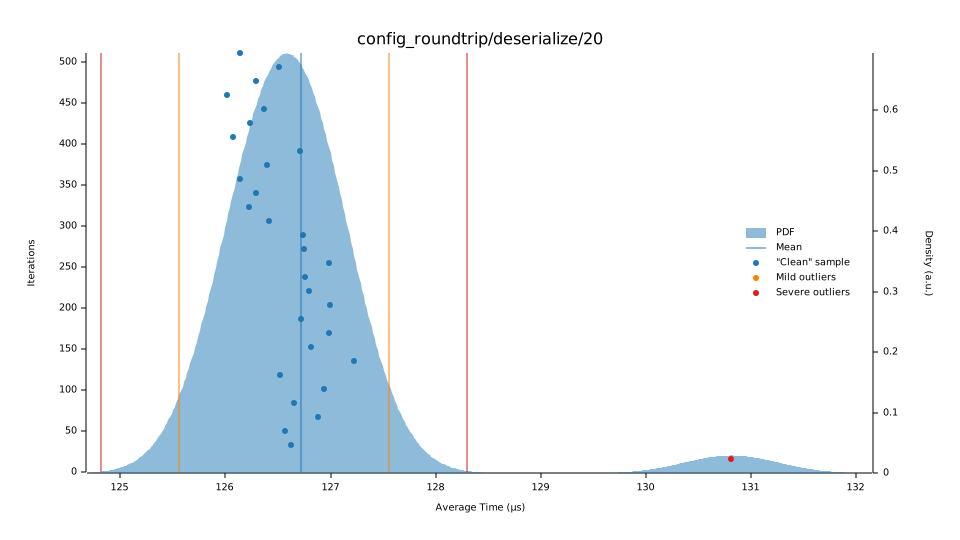
|
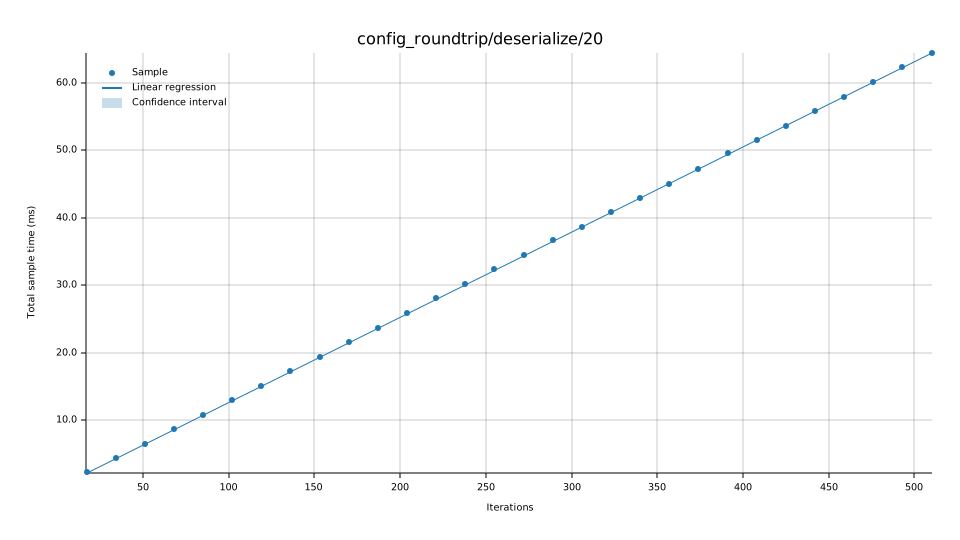
|
config_roundtrip/deserialize/50
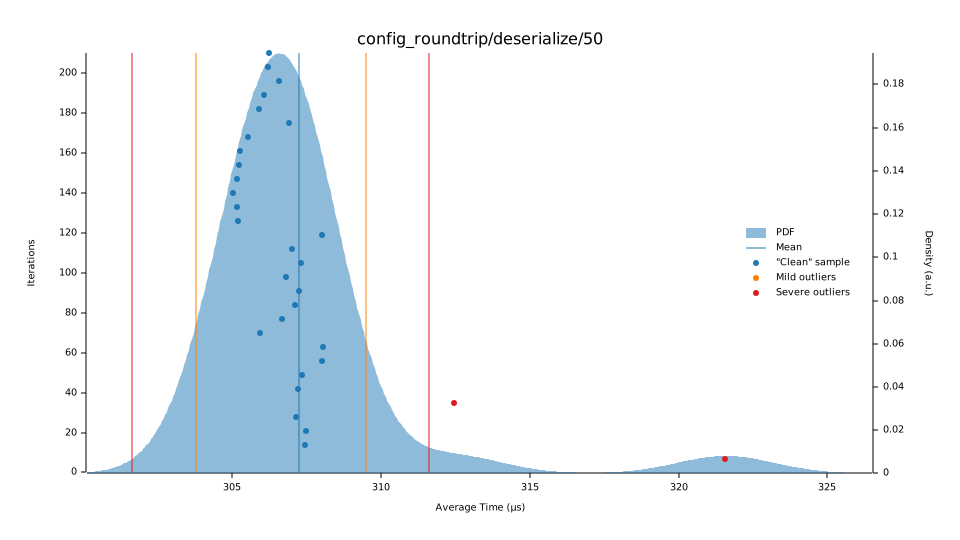
|
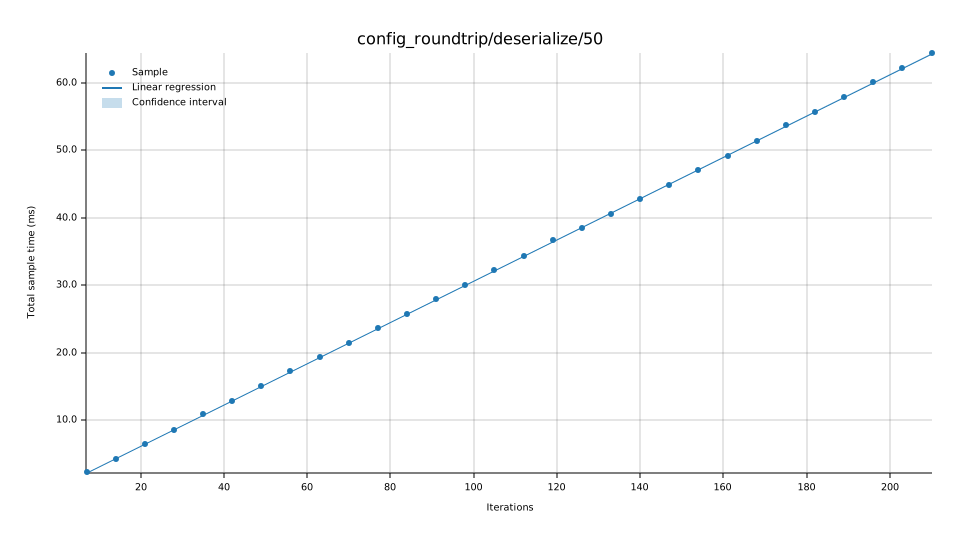
|
config_roundtrip/deserialize/100
|
|
config_roundtrip/deserialize/500
|
|
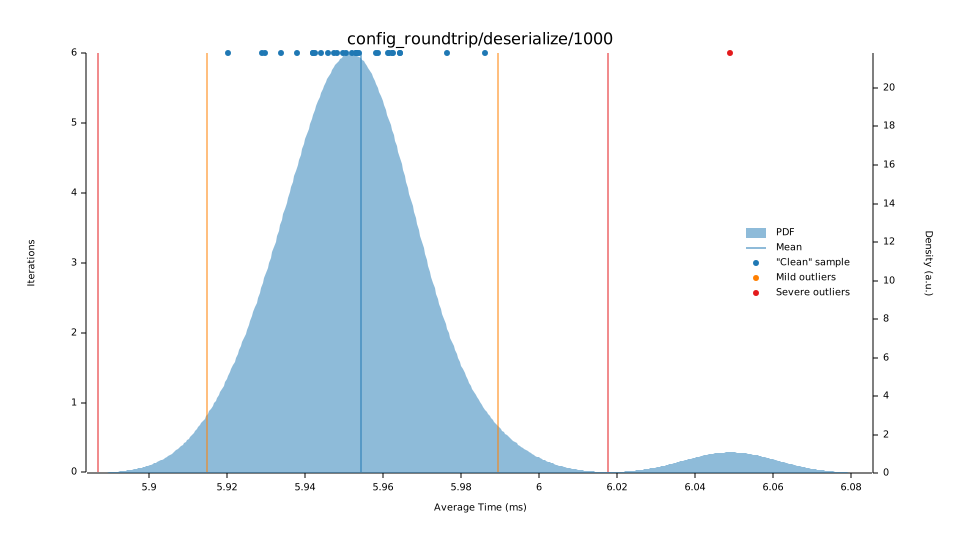
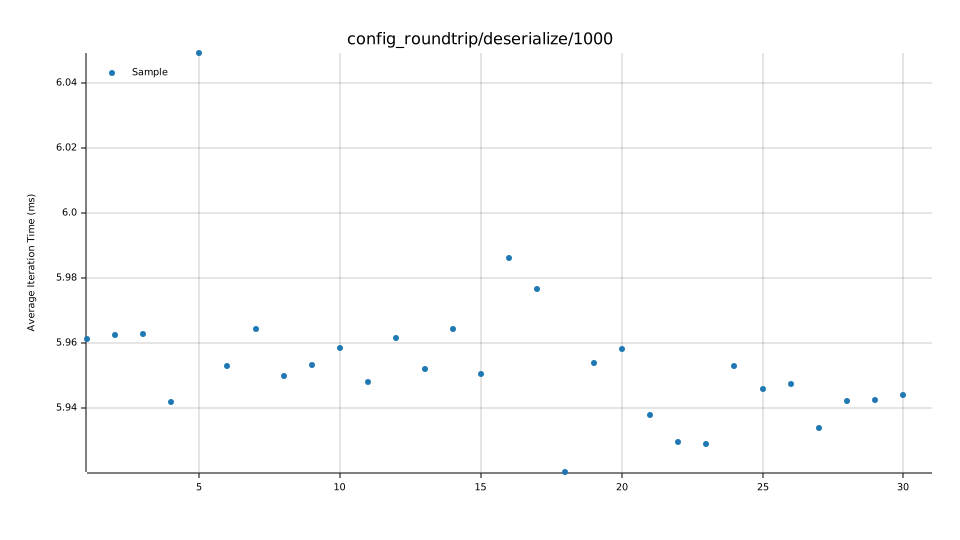
config_roundtrip/deserialize/1000
|
|
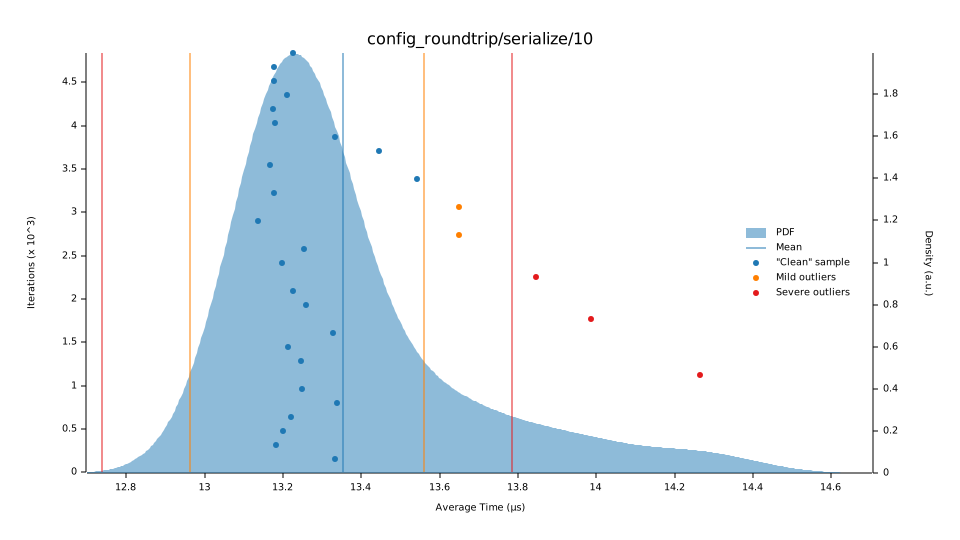
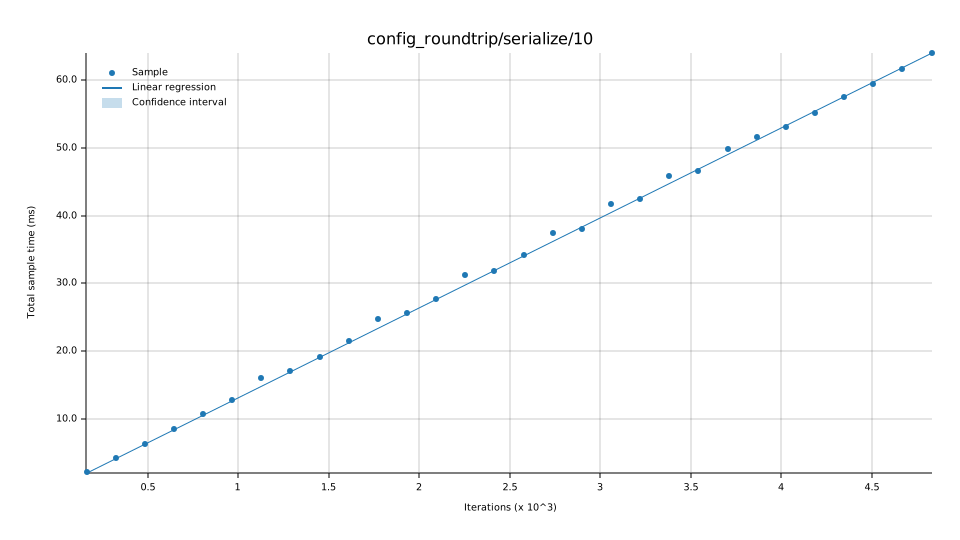
config_roundtrip/serialize/10
|
|
config_roundtrip/serialize/20
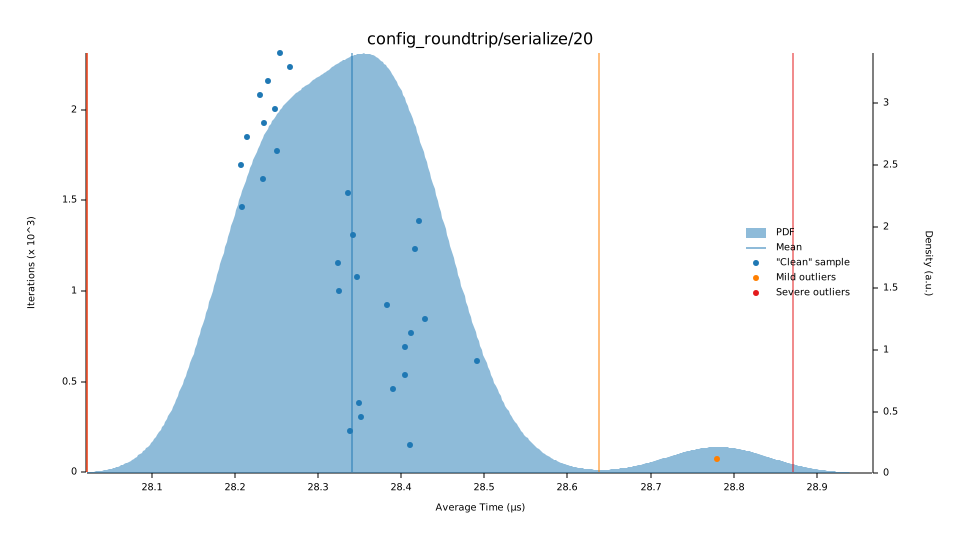
|
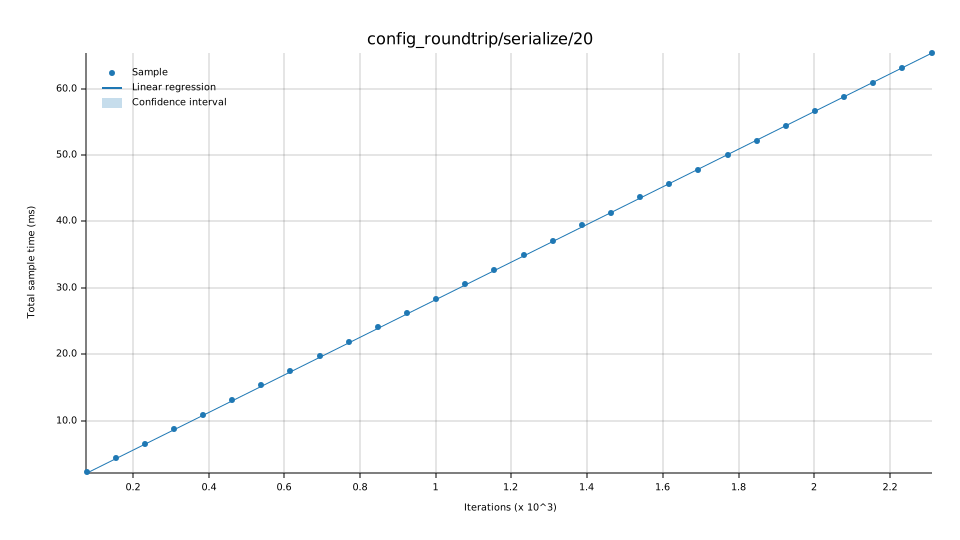
|
config_roundtrip/serialize/50
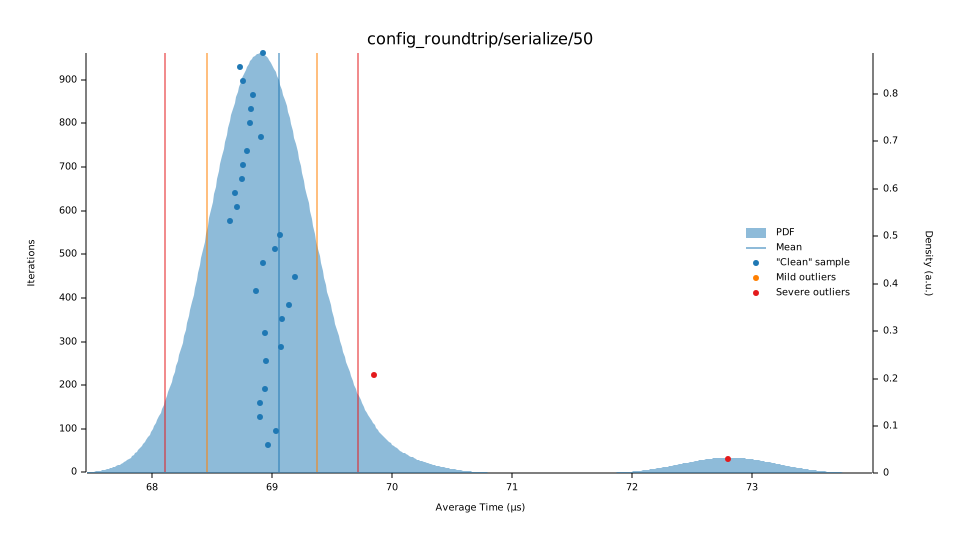
|
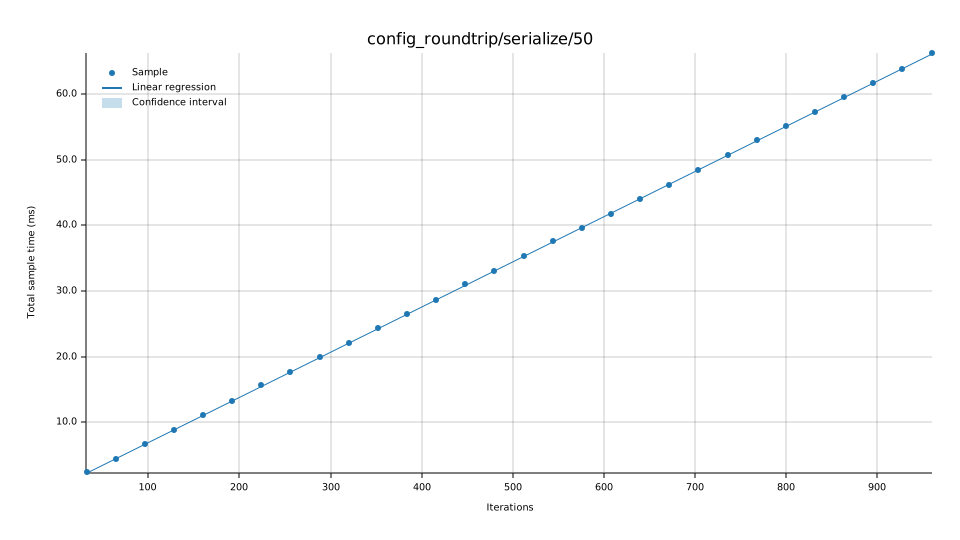
|
config_roundtrip/serialize/100
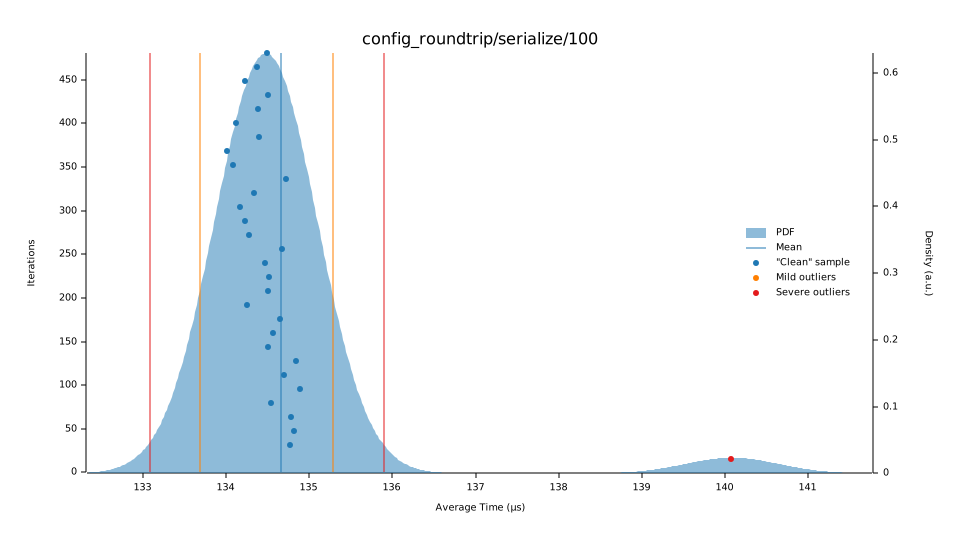
|
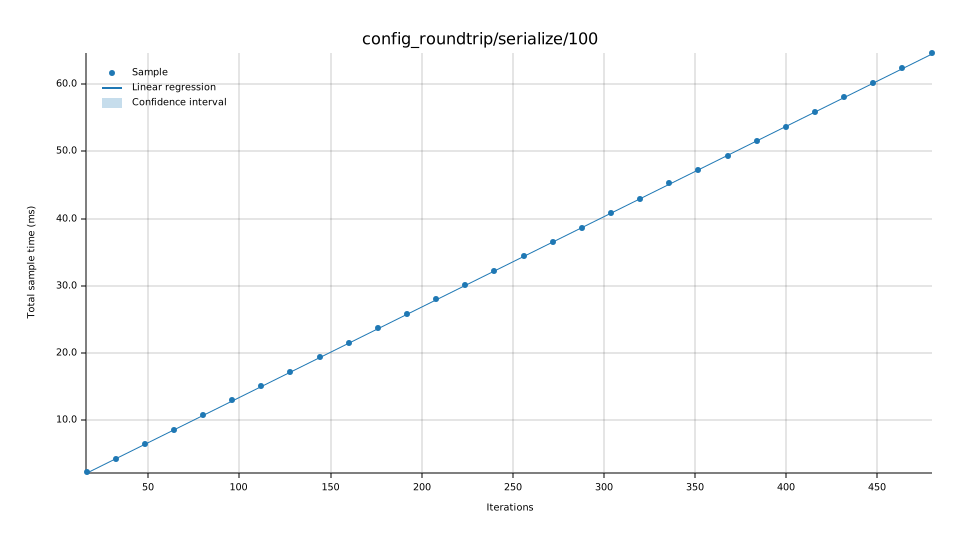
|
config_roundtrip/serialize/500
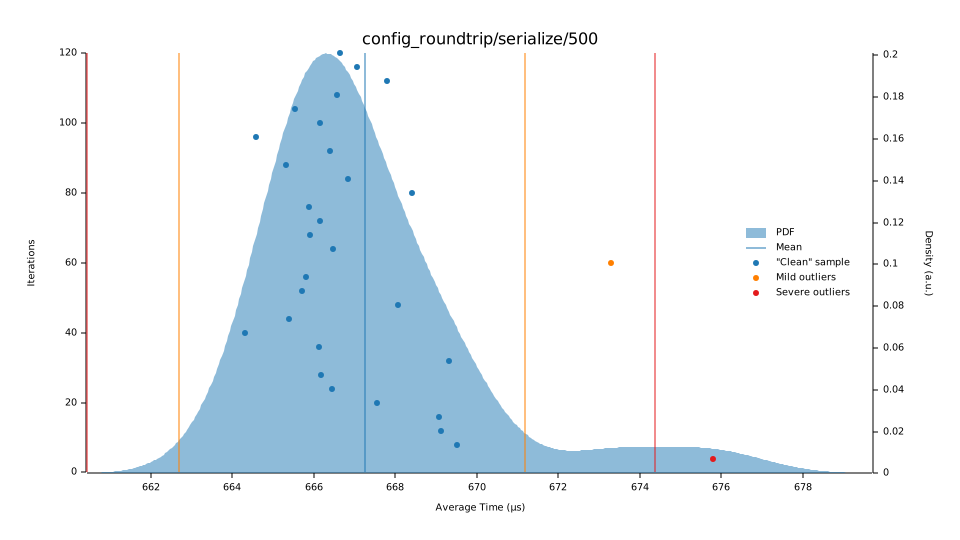
|
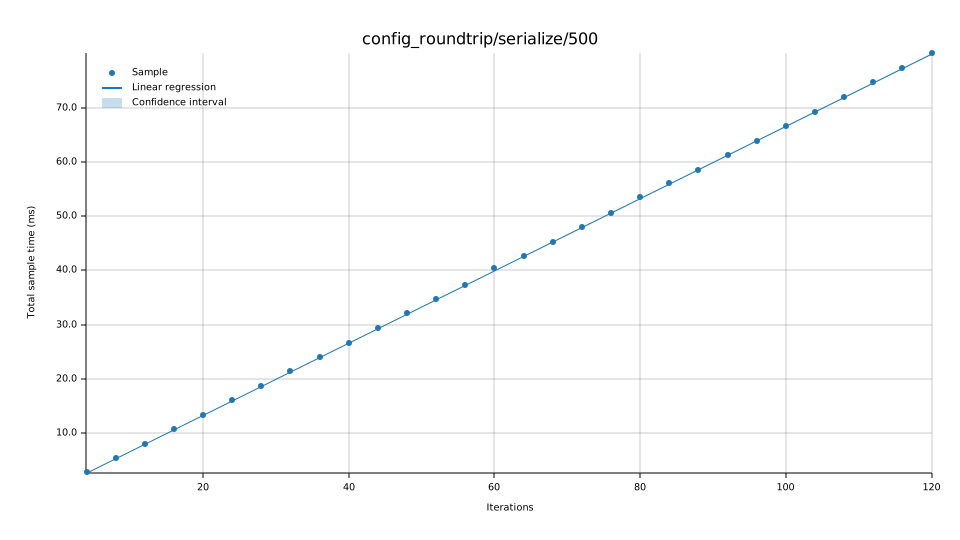
|
config_roundtrip/serialize/1000
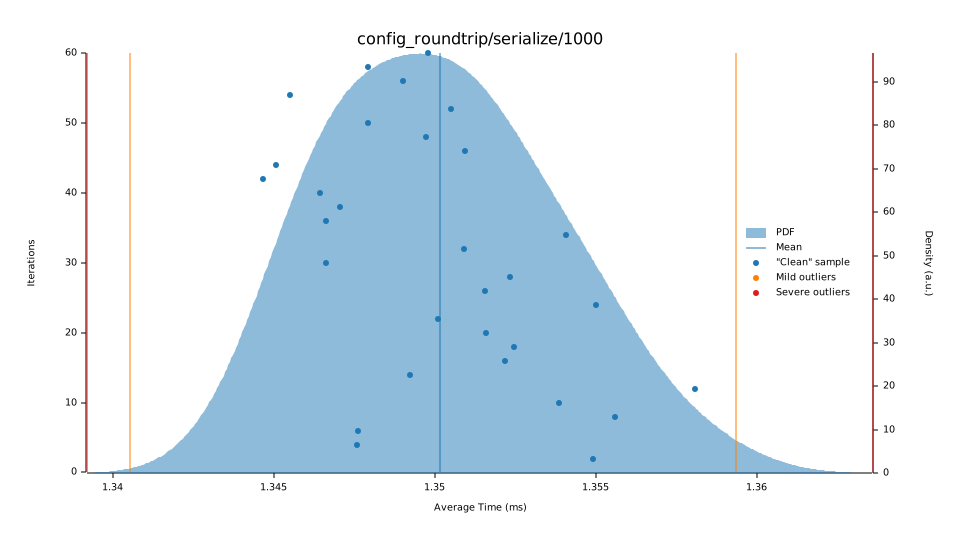
|
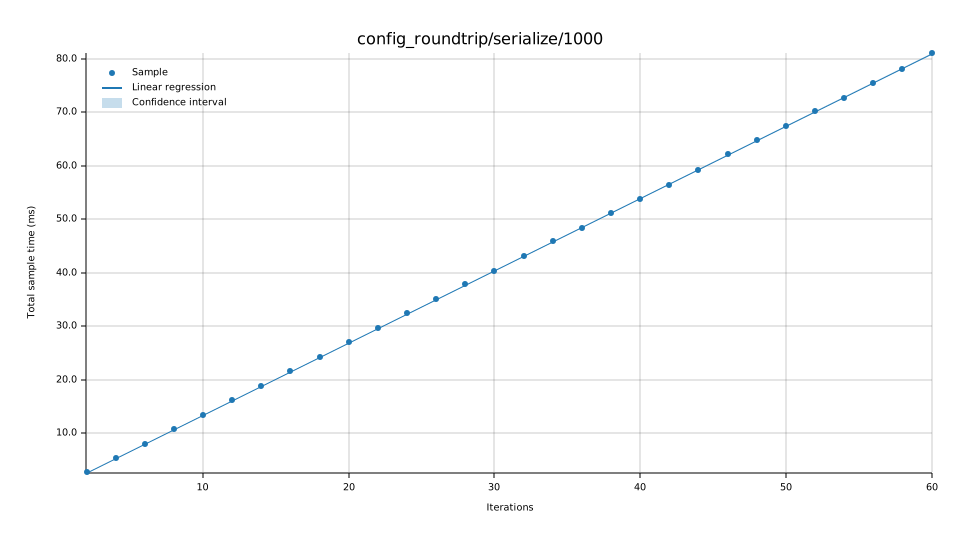
|